Editor’s note: This briefing was written by Bruker Optics. Bruker Optics will be exhibiting (booth 400) at the 235th ECS Meeting in Dallas, TX this May. See a list of all our exhibitors.
Introduction
 Electrochemical investigations are a very current topic in research. In recent times advancement in technology and industry results in a world-wide increasing energy consumption. A future requirement to face this trend is the development of high capacity and as well low weight rechargeable batteries for energy storage. Therefore studies of electrolyte systems or electrode surfaces are of great importance for possible further improvements.
Also in other fields, like biochemistry or catalysis, electrochemistry is of great benefit to get access to information of molecules, depending on an applied electrochemical potential. For example of the redox-active center in biomolecules [1], the reaction behavior of catalysts or the formation of carbon oxides during alcohol oxidation.
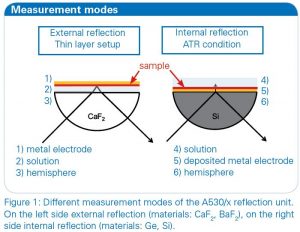
The combination of FT-IR spectroscopy with electrochemistry offers insight in the molecular change and the reaction process of the studied molecules in addition to the electrochemical response of the experiment. This valuable method can be applied for investigations of electrolytes or of electrode surfaces. With the BRUKER A530/x reflection unit prepared for electrochemical cells the opportunity is given to study both [2]. For an external IR reflection-absorbance spectroscopy (IRRAS) set-up a thin layer configuration is used which allows the study of the electrolyte and the electrode surface. Alternatively an internal reflection ATR set-up can be used to analyze the electrode surface directly with limited influence of the electrolyte (see figure 1).
 Furthermore for the IR spectroelectrochemical investigation of dissolved molecules in solution Optically Transparent Thin Layer Electrochemical Cells (OTTLE) are also well known for transmission measurements [3, 4]. Therein the working electrode consist of a semi-transparent metal minigrid. Therefore the molecules can be studied directly in the vicinity of the electrode surface with transmission measurements.
In this application example we will study the oxidation of ferrocyanide [Fe(CN)6]4- and the dependance of the CN– ligand stretching vibration on the oxidation state of the iron center (FeII or FeIII). This system is also discussed in detail in the literature [5]. Additionally we will determine the layer thickness within the external reflection mode.
Instrumentation
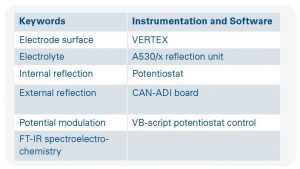
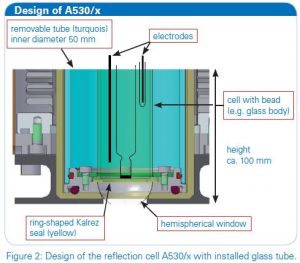 The experiments were conducted with a purged VERTEX FT-IR spectrometer equipped with the A530/P accessory and a mid-band MCT detector. A representation of the reflection cell A530/P as used in the experiment is depicted in figure 2, showing the installation of the different components, a glass body and electrodes. The measurement parameters were 4 cm-1 resolution and 100 scans. A MIR polarizer was installed and p-polarized light was used for the investigations. The experiments were controlled by the FT-IR spectrometer using a software script and a connection with the CAN-ADI board to a Gamry 600 reference potentiostat. A thin gold plate disk was used as working electrode, and silver and platin wires as quasi-reference and counter electrodes.
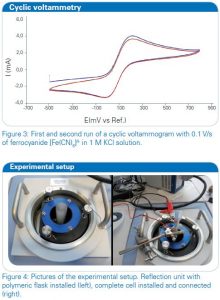 Investigations were performed on a 20 mmol/l solution of potassium ferrocyanide K4[Fe(CN)6] in water and additional 1 mol/l potassium chloride KCl as supporting electrolyte. For the study of the dissolved metal complex the solution was measured using a silicon hemispherical window (F530-8) in the ATR mode with the working electrode placed 1 mm above the window.
Investigation in the external specular reflection mode were performed using a barium fluoride hemispherical window (F530-17) and a gold electrode pressed against the window creating a thin layer between them.
Results and discussion
A cyclic voltammogram (current at the working electrode plotted versus the working electrode potential), which is depicted in figure 3, of this redox system was recorded to get an overview of the oxidation and reduction potentials. Afterwards the solution of potassium ferrocyanide was investigated with in situ FT-IR spectroelectrochemistry.
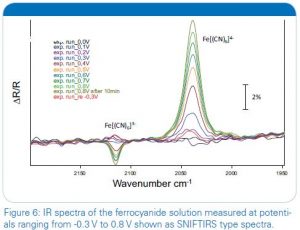
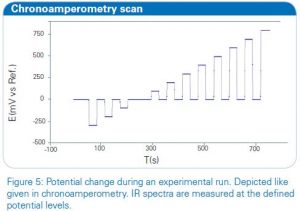 The quasi-revesible redox process for the reaction [Fe(CN)6]4-⇌ [Fe(CN)6]3-+e– can be seen in this system and the oxidation and reduction peak are well resolved. The in situ FT-IR spectroelectrochemical experimental setting is depicted in figure 4. The experiment can be controlled in a way that the potential is set in steps to a desired value. Between every potential increase the value can return to a specified reference potential to control the reversibility of the electrochemical process. A diagram of one experimental run is shown in figure 5 exemplarily, starting from Estart = -0.3 V to Eend = 0.8 V and returning after every step to a reference potential Eref = 0 V. After a certain delay, which is also specified in the control script, at every level shown in the graph, a defined number of IR spectra are co-added and averaged.
 After the start the experiment runs independently with a duration of approximately twenty minutes in this example. Afterwards the collection of IR spectra can be analysed and presented in different ways. One common possibility is the use of SNIFTIRS type diagrams (Subtractively Normalized Interfacial Fourier Transform IR Spectroscopy) [6], in which the y-scale of the graph represents the following ΔR/R = (Rx– R0)/R0. An example of it is shown in figure 6 for the oxidation of [Fe(CN)6]4- in the spectral range between 2200 and 1950 cm-1 and with cell potentials ranging from -0.3 V to 0.8 V. As can be seen clearly the decrease of the reduced form of the molecule [Fe(CN)6]4- in solution is indicated in this representation by the increasing band at 2039 wavenumbers.The formation of the oxidized form ferricyanide [Fe(CN)6]3- in solution can be seen by the decreasing band at 2115 cm-1. Additionally a slightly yellow color of the solution could be observed.
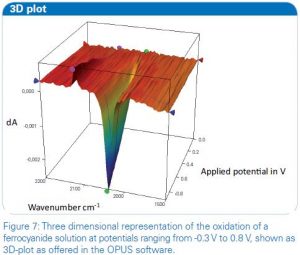 When the potential returns to a value of -0.3 V the spectrum resembles again the spectrum of the starting potential, which points out the reproducibility of the experiment. So again the reduced form [Fe(CN)6]4- is present is solution.
Alternatively the course of the reaction can be illustrated with a 3D-plot showing directly the change in absorbance of the infrared bands during the measurement. Therefore the Time-Resolved-Spectroscopy (TRS) postrun window of the OPUS software offers useful functionality. A plot for the oxidation of the ferrocyanide solution measured in ATR conditions is shown in Figure 7.
For the study of small layers on electrode surfaces and electrolytes, alternatively to the ATR mode, a thin layer experimental set-up can be used. For this external reflection mode of the electrochemistry accessory one of the important parameters to know is the thickness of the layer, created between the electrode surface and the hemispherical window. The thickness can be determined easily after the positioning of the metal working electrode on top of the hemispherical window (low refractive material) and prior to the addition of the electrolyte. For the determination the interferences are used which arise from the IR beam path going through the flat surface of the hemispherical window of the cell. Figure 7 shows the interference pattern 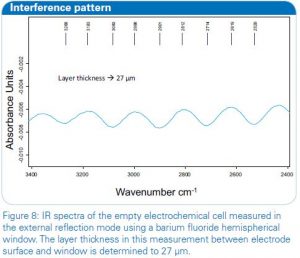 without electrolyte in the cell which calculates a layer thickness of 27 μm. The path length can be determined easily with the Layer Thickness function as integrated in the OPUS software. By doubling this value for the IR path (in and out of the electrochemical cell), the IR beam would penetrate about 50 μm of the electrolyte solution during the measurement.
Conclusion
The electrochemical oxidation of a metallic complex, ferrocyanide [Fe(CN)6]4- was studied with FT-IR spectroelectrochemistry. This combined analysis method offers the possibility to investigate the molecular change of this compound depending on the applied electrochemical potential. The oxidation to ferricyanide [Fe(CN)6]3- was illustrated in the form of a SNIFTIRS spectrum and a 3D-plot with the OPUS software. One main advantage of the set-up reported here is, that the potentiostat and the spectrometer are connected by the CAN-ADI board and a VB-script for an all-over communication is used. After setting the experimental parameters and the desired potential procedure, the measurement can be simply started in OPUS and will run automatically. The resulting spectra will be well sorted and assigned to their corresponding potential for subsequent evaluation. In the end, the technical realization of the combination of FT-IR spectroscopy and electrochemical investigations makes the in situ monitoring of electrochemical processes easy and reliable.