


The Electrochemical Society hosted Reed M. Wittman and Yuliya Preger’s live webinar, “Degradation of Commercial Lithium-Ion Cells Beyond 80% Capacity,” on July 12, 2024. Following the presentation, the speakers took audience questions during a live Question and Answer session. Any questions not answered during the broadcast were answered in writing (see below).
Replay Webinar
(Click to enlarge)
Q&A
Nothing was said about charging conditions: Taper charge? End-of-charge voltage?
The cells were charged at constant current constant voltage. The taper charge was held until current was equal to or less than 0.05A. Find full experiment details at https://iopscience.iop.org/article/10.1149/1945-7111/abae37/meta.
Are there any practical takeaways for battery users based on this finding?
The general takeaways are (1) the impact of cycling conditions varies for different cells; it is worthwhile to do cell-specific testing; (2) even within manufacturer specified operating ranges, the equivalent full cycle count can vary by thousands of cycles depending on the cycling conditions.
Generally, expanded SOC range increases the rate of degradation for all Li-ion cell chemistries. Temperature dependence will depend on the cell and C-rate shows a mixed trend depending on cell chemistry and capacity.
We also see that cells can be cycled significantly beyond 80 percent capacity depending on the conditions.
Did you find anode cracking or cathode cracking that will lead to nonlinear behavior (except Li plating)?
We did not see such a trend that would lead to non-linear behavior outside of Li-plating in our data set.
What is the concentration of NMC in your experiments? As for our NMC532 tests, we found nonlinear degradation behavior.
The NMC cells were calculated to 811.
What is the cost of manufacturing the postmortem LIB? Is it preferable to use the new manufactured one?
We assume the question is about the cost of using fresh batteries versus “second-life” batteries that were previously cycled in another application. The cost depends on many factors including the changing economics of new battery manufacturing; the balance of plant components needed for systems composed of batteries at different states of health; the remaining useful life of the batteries; etc. The goal of the present study was just to address the question of remaining useful life.
You were tracking S via EDS earlier; was that from electrolyte breakdown?
EDS was used to determine the presence of various electrolyte elements including sulfur.
How does Li plating affect the NMC?
Irreversible Li plating reduces the capacity of the battery by trapping it at the surface of the negative electrode where it cannot be used anymore. Additionally, it may lead to mechanical deformation (as seen here: https://iopscience.iop.org/article/10.1149/1945-7111/ad1450/meta) which further reduces the battery capacity.
In Slide 24, SEI dominated. Is it indicating that fluorine and sulfur concentration, higher the better?
We do not make a determination of what elements present in the SEI are “better.” In this slide we measured the concentration of elements related to SEI formation to identify which degradation mechanism was dominating.
Was a 70-100 percent SOC test condition considered? It is hard to understand if the full 0-100 cycle is a contribution to degradation or just the upper portion 80-100 is what hurts the cell.
We agree that it is worthwhile to study the impact of more SOC windows. The following studies offer some useful data on this topic: https://www.sciencedirect.com/science/article/pii/S0378775313016510?via%3Dihub. At the start of our study, we were limited by channel availability.
Are LLI, LAM, CL estimated by incremental capacity?
Although not presented in this webinar, the following publication shows the delineation of different degradation modes using ICA: https://iopscience.iop.org/article/10.1149/1945-7111/ad1450/meta.
Looking at C rates/charging: did you consider pulse charging or similar and their effect on capacity degradation?
Other studies have looked at the impact of pulse charging on capacity degradation. For this particular study, we were trying to isolate the impact of temperature, SOC range, and discharge C rate.
Given the data, do you feel LFP could heavily outperform other chemistries due to their longevity?
Performance and degradation ultimately come down to the specific application. However, at their preferred operating conditions, the LFP cells that we were using did have a much higher total energy throughput than other cells.
What is the difference between cyclic and calendar aging; is calendar aging self-discharge?
Calendar aging refers to degradation that is not due to the movement of Li through charge and discharge of the battery. The loss of capacity from self-discharge is reversible in that the cell can just be recharged. In this presentation, calendar aging is considered an irreversible drop in capacity. Calendar aging is caused by side reactions such as SEI formation, which is accelerated at higher temperatures and SOC.
You mentioned loss of Li inventory; where does the Li go?
The Li is captured into products that cannot be used to charge or discharge the battery, such as irreversible Li plating and SEI formation at the negative electrode.
What is the voltage window used for 0~100 percent SOC cycling for NMC and NCA cells? Are they the same?
The full experimental details of the study are provided here: https://iopscience.iop.org/article/10.1149/1945-7111/abae37.
You imply that the observations are tied to the cathode type: NMC, NCA, LFP. Are not other parameters such as negative electrode materials and design more determinative to degradation rates? Could it not be misleading to generalize these observations to cathode type?
The whole design of a battery impacts its cycle life and some of the most notable degradation mechanisms (e.g., SEI formation) are related to the negative electrode. In this case, we distinguished the cells based on their cathodes as the use of a particular cathode impacts many other design choices for a cell.
In your opinion, what are the most critical operating parameters to ensure homogeneous remaining capacity among LFP cells in modules and packs?
Cell-to-cell heterogeneity arises due to both physical differences based on manufacturing tolerances and exposure to different use conditions. The former can be controlled by tighter manufacturing tolerances or better initial grading of cells (i.e., minimizing the resistance/capacity differences of the cells that are placed into the modules).
During operation, modules or packs can experience thermal gradients if there is inadequate thermal management. This can impact the aging trajectories of different cells depending on their location. Additionally, cells can experience different current throughputs depending on the design of the module or pack, especially the interconnect resistances. Variations in the rate of the current and the total energy throughput in cells may contribute to heterogeneous aging.
Did you do any LLI or SEI performance analysis of the NMC cells above 40C?
We did not do any testing above 40C.
Capacities of cells are different depending on chemistry. So, the actual 0.5C rate of charge represents a significantly different current of charge (similarly for discharge). How do you factor it in?
Each cell’s charge and discharge current is based on the nominal capacity of the cell. For example, the NMC cells have a capacity of about 3 Ah. C-rate is defined as the current required to charge the battery in a given time. 1C corresponds to the current required to charge or discharge the battery in one hour, in this case 3 A. So, 0.5C was determined to be 1.5 A for the NMC cells, 1.6 A for the NCA cells, and 0.55 A for the LFP cells depending on their nominal capacities.
Given the dependencies of the capacity degradation pre-80 percent capacity, can we assume that different parameters tested do have an effect in predicting the cycle life of batteries?
It appears that all the parameters tested (temperature, SOC range, discharge C-rate) do have an impact on cycle life to some degree and should be considered when developing models for lifetime prediction.
How do you experimentally differentiate LLI and LAM?
We look for specific degradation mechanisms that are associated with each mode of degradation. LLI is commonly associated with SEI formation and Li-plating, while LAM is associated with metal dissolution, particle cracking, and material loss. We target our characterization techniques to look for these phenomena specifically: https://iopscience.iop.org/article/10.1149/1945-7111/ad1450/meta.
Are there similar studies or databases done for post Li-ion batteries (e.g., Na-ion, Mg-ion, lithium solid state batteries)?
We are currently extending the Battery Archive to other kinds of battery data.
What do you think about the impact of varying checkup frequencies and (unintended) rest phases during the cycling?
Rest times between rounds of cycling have been shown to impact capacity degradation. Two notable studies include https://iopscience.iop.org/article/10.1149/2.0201502jes and https://chemistry-europe.onlinelibrary.wiley.com/doi/10.1002/batt.202000160. In these studies, the authors proposed that these rests gave reversibly plated Li time to reintercalate.
Has Li-ion cell technology advanced since the start of this study that may affect the results/conclusions?
The cells that we used were purchased in 2016. We would expect component material improvements over the years to have increased cycle life. It is difficult to provide a quantitative estimate for this improvement. Part of the motivation for creating batteryarchive.org was to compare public battery cycling data over the years.
Any changes in characterization techniques at 40 percent cycle life compared to 60 percent?
We have not done the 40 percent characterization work yet.
Thanks for sharing batteryarchive.org. Any suggestions for a lead acid battery performance archive?
We are currently extending Battery Archive to other kinds of battery data.
Since the focus of the cycling experiments are for using energy storage for renewable energy storage application, is that why the charging currents are kept at 0.5C and discharge currents are varied? Or is there any other rationale behind keeping the charging currents at 0.5C and varying the discharge currents?
Those factors were the main reason for specifying such a duty cycle in 2016.
Are these trends universally applicable or will they vary by using cells from different manufacturers?
Trends will vary to some extent based on the manufacturer, but these trends do seem to hold in the literature. We compared our cycling trends to those in other studies in the following publication: https://iopscience.iop.org/article/10.1149/1945-7111/abae37 (see Table III).
Generally, expanded SOC range increases the rate of degradation for all Li-ion cell chemistries. Temperature dependence will depend on the cell and C-rate shows a mixed trend depending on cell chemistry and capacity.
Do you have any early indication on why LFP cell SOH degradation follows 15,25,35?
We are starting materials characterization on disassembled cells to probe this trend.
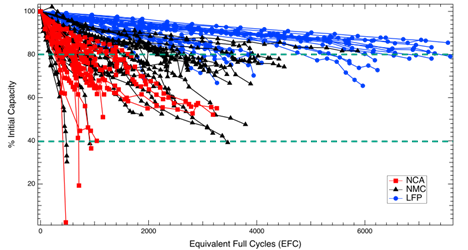
SOC range comparison in NCA cells: What are the equivalent full cycles of compared cells?
All the cycling numbers shown are in equivalent full cycles. In this work, one EFC is based on the nominal capacity of the cell. Therefore, for each cell, the total capacity throughput was divided by the nominal capacity to get the total equivalent full cycle count.
What do you attribute to the capacity increase of some cells during cycling?
Previous studies have shown that periods of rest between rounds of cycling give reversibly plated lithium time to reintercalate into the electrodes (and thus raise the capacity). The cells in this study were rested for a greater length of time on two occasions: during a lab move and between the end of the pre-80 percent study and the start of the post-80 percent study.
Learn more about upcoming ECS Webinars and review our previous webinar recordings.
Thank you to our webinar sponsors who make these complimentary programs possible!
Interested in presenting in the ECS Webinar Series? Email your presentation title and abstract to education@electrochem.org for consideration.