 The Electrochemical Society hosted Weiran Zheng’s live webinar, “Introducing Python for Electrochemistry Research,” on August 28, 2024. A live Question and Answer session followed. Dr. Zheng’s answers to questions not addressed during the broadcast follow.
NOTE: Registration is required to view the webinar replay.
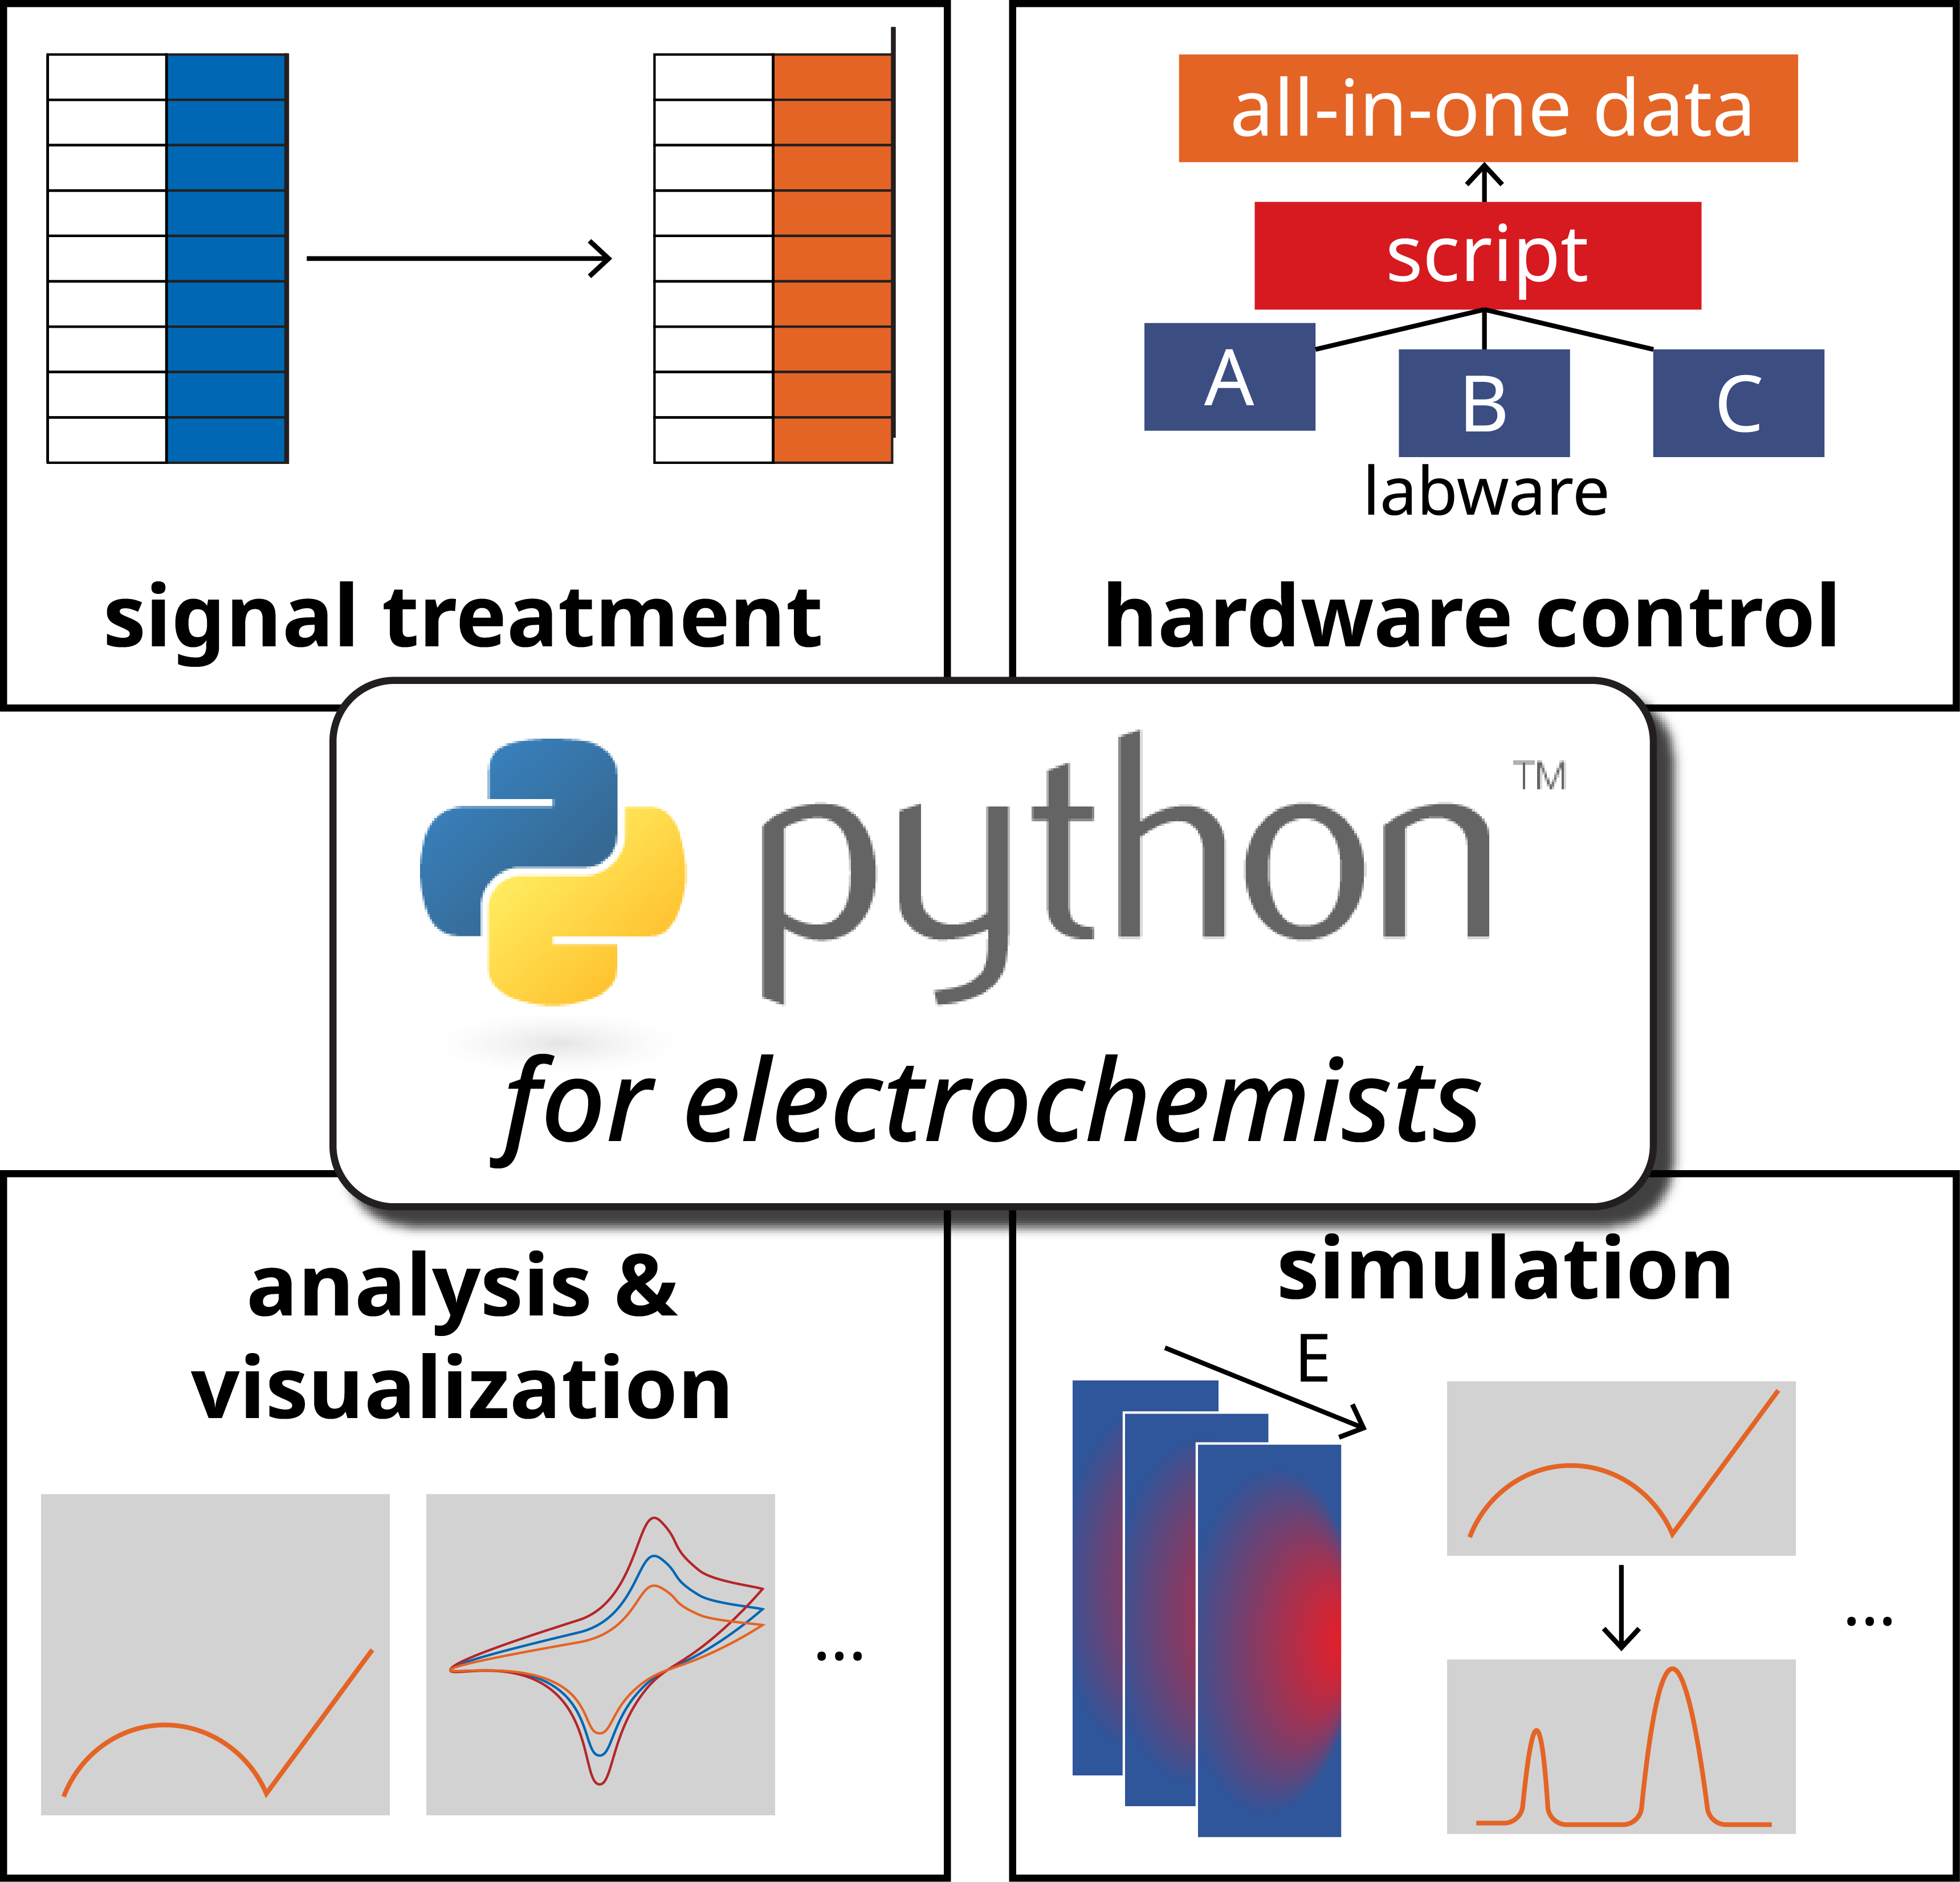
Python logo used with permission of the Python Software Foundation (Dr. David Mertz, Co-chair, Python Software Foundation Trademarks Committee)
Q&A
You showed Matplotlib and Seaborn. Are there any advantages for using Matplotlib or Seaborn over the other?
Matplotlib and Seaborn are both great for data visualization in Python, each with its own perks. Matplotlib is flexible and lets you customize every detail, perfect for complex plots. Seaborn, on the other hand, is built on Matplotlib but offers a simpler interface and modern look, making it easy to create attractive plots quickly. While Matplotlib gives you control over the fine details, Seaborn is all about ease of use for making clear, informative graphics. You can use them together, using Seaborn’s simplicity and Matplotlib’s detailed customization.
Can you use your notebooks or functions for different experiments and only change the imported data, or do you have to write a new script every time since you must change the plotting and the data correction every time?
You can reuse Jupyter Notebooks and functions for different experiments by organizing your code to be modular and adaptable. Write reusable functions for data cleaning, analysis, and plotting, allowing you to change only the input parameters. Utilize configuration files or cell inputs to adjust file paths and experiment-specific settings without altering core code. Store these functions in separate scripts or modules for easy import into notebooks. Additionally, create a template notebook with placeholders for data import and parameters, streamlining adaptation for various experiments. This approach minimizes the need to write new scripts for each experiment, saving time and effort.
Can you suggest any support videos for learning Python for electrochemistry?
There are many YouTube videos available for both beginner and advanced Python courses. While I can’t provide direct links to each of them, they’re super easy to find. Additionally, resources like “Python for Chemists” by Kiyoto Aramis Tanemura, Diego Sierra-Costa, and Kenneth M. Merz, Jr. offer excellent guidance for chemists learning Python.
Are those example codes and materials accessible via GitHub?
Yes, the code and slides are available at https://github.com/zhenggroup/demo-for-ECS.
Compared to conventional EIS equivalent circuit fitting, how is Python beneficial for this?
Python is great for EIS equivalent circuit fitting because it offers flexibility and powerful tools for customization. You can automate repetitive tasks and handle large datasets easily. Visualization is improved with libraries like Matplotlib, making it easier to analyze and present data. Plus, Python integrates well with other tools, streamlining the analysis process. Moreover, there are quite a lot of packages available for EIS analysis, from KK (Kramers-Kronig) Validity and DRT analysis to modeling, such as DRTtools, PyEIS, DearEIS, etc.
Is there a good place to find open-source example data that can be used to practice different Python functions (e.g., joining electrochemical data to an in situ study or noisy EIS data)?
Yes, there are several great places to find open-source example data for practicing Python functions. Platforms like Zenodo, figshare, and Mendeley Data offer datasets across various scientific fields including electrochemistry. Additionally, many Python packages come with example data, which can be invaluable for learning how to perform tasks like joining datasets or handling noisy EIS data.
You mentioned that Python is slow in handling large datasets. Do people use R for electrochemistry? How does R compare with Python for electrochemistry?
Both Python and R are used in electrochemistry (you can find examples in GitHub), each with unique strengths. Python is versatile, with extensive libraries for data analysis, machine learning, and visualization, and it integrates well with other tools, making it ideal for complex workflows. It also benefits from a large community for support. R, on the other hand, is good at statistical analysis and offers powerful visualization tools like ggplot2. It’s often used for specific statistical tasks. The choice between Python and R depends on the project’s needs and personal preference, but Python is generally favored for its versatility and integration capabilities.
I have always wanted to learn Python for data organization and visualization in my electrochemistry. I have not used programming before, so the big code scares me. How do we overcome this?/Do Python’s courses serve to learn easily? Or is it just practicing enough?
Starting with Python can feel overwhelming, but you can tackle it by taking small, manageable steps. Begin with basic tutorials to get comfortable with the language, focusing on short, simple scripts. Try interactive platforms like Codecademy or freeCodeCamp for user friendly lessons. Apply what you learn to small projects in your electrochemistry research, like creating simple data plots. Use libraries like Pandas and Matplotlib to make data handling and visualization easier—they’re designed to simplify complex tasks. Join online communities to ask questions and share experiences. By gradually building your skills and focusing on practical applications, you’ll gain confidence and comfort with Python.
How can we get help from AI (ChatGpt) to learn/code Python? Do you find them helpful?
AI tools like ChatGPT are great for learning Python. You can ask questions, get help with code errors (which is super important, especially if you are learning by yourself), and get examples for specific tasks. They can also suggest tutorials and resources to guide your learning, plus offer practice problems to build your skills.
Isn’t it much easier to use commercial software instead of programming something yourself with Python?
Yes, it’s easier but can be very expensive. Learning to program not only aids in solving tasks but also enhances your understanding of your electrochemical system. Additionally, the open-source community provides strong support with free tools available for everyone.
Are the Biologic and Gamry packages free to use? Are real data sets available for free to practice Python codes?
Most Python packages are free to use with proper citation. Packages for handling Biologic and Gamry data are available on PyPI (Python Package Index) and GitHub. To practice with real datasets, consider using open-source data from platforms like Zenodo.
How efficient is Python for solving partial differential equations and performing a nonlinear fitting of the model compared to other languages like C++ or R?
Python is pretty good for solving partial differential equations and nonlinear fitting, thanks to libraries like SciPy and NumPy. While it’s slower than C++ because it’s an interpreted language, it’s much easier to use and develop with. C++ is faster but more complex to code. R is great for statistical modeling but not as strong with PDEs (partial differential equations). Overall, Python’s balance of ease and functionality makes it a popular choice.
Can Python read/solve/model “xxx” problem (a general question) ?
Python is versatile thanks to its wide range of packages, each offering different features. For tasks like importing, manipulating, and outputting files in common formats, there’s likely a package that fits your needs. Beginners should check the documentation and tutorials these packages provide to understand what they can do.
Would you recommend any plotting packages on Python with a GUI? Matplotlib is a bit of a pain to make publication-quality plots, particularly compared to OriginLab (but maybe that’s my lack of patience/experience!).
If you’re looking for Python plotting packages with a GUI (Graphical User Interface), consider using Plotly or Veusz. Plotly offers interactive plots and a GUI editor through Plotly Chart Studio, and Veusz is specifically designed to generate publication-quality plots with a user-friendly interface. These tools can make it easier and more intuitive to create high-quality plots, especially if you’re used to GUI-based software like OriginLab.
We thank our webinar sponsors who make these complimentary programs possible!
![]()