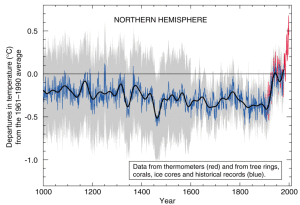
 For the past several years, there has been one image that has been central to the climate change debate: the infamous “hockey stick” graph.
Since the graph appeared in the paper “Northern hemisphere temperatures during the past millennium: Inferences, uncertainties, and limitation,” Michael Mann has been hard at work defending his research.
“The hockey stick graph became a central icon in the climate wars,” Mann said at the Feb. 11 meeting of the American Association for the Advancement of Science. “The graph took on a life of its own.”
The graph gained notoriety when the Intergovernmental Panel on Climate Change published the image and starting using it to drive home the message of climate change. The graph still remains an ever-present part of the climate debates.
This from Pennsylvania State University:
The original paper and the IPCC report demonstrated that temperature had risen with the increase in industrialization and use of fossil fuels. The researchers’ conclusion was that worldwide human activity since the industrial age had raised carbon dioxide levels, trapping greenhouse gases in the atmosphere and warming the planet.
However, many challenged the findings. Some challenged it on its scientific merit, while others blindly challenged it to advance either political, religious, or economics agendas. Subsequent investigations were conducted by the National Academy of Sciences, the National Science Foundation, and Pennsylvania State University, all of which found the research to be credible and accurate.
Those who criticize the science behind the hockey stick graph state that it ignores such things as the Little Ice Age and Medieval Warming Period, yet Mann retorts by stating that these extremes are examples of regional, not global, phenomena. (Check out this video on why people don’t believe in climate change.
As part of his defense, Mann has created a blog called RealClimate.
“We’re already committed to 50 to 100 years of warming and several centuries of seal-level rise, simply from the amount of greenhouse gases we’ve already put in the atmosphere.” The solution, he tells Scientific American, “is going to be finding an appropriate set of constraints on fossil-fuel emissions that allow us to slow the rate of change down to a level we can adapt to.”
For more facts on climate change, take a look at the majority report released by the Intergovernmental Panel on Climate Change, capping its latest assessments. The report establishes with 95 percent certainty that nearly all warming seen since the 1950s is due to human activity. Read the rest here.
Here at ECS, we believe it’s time to get serious about climate change. Our scientist are working to understand the effects that climate change has on the environment, and work toward providing solutions, such as: innovations in solar, advances in fuel cell vehicles, and transitioning our publications to open access.

